Save the Free Press: Receive a Free Financial Gift
MARKET Watch
by Romulus at Backpack TraderIn the great murder mysteries, the killer returns to the scene of the crime. I don’t know if this is because they want to re-live the experience or get rid of any lingering evidence, but back to the scene they go.
There is something like this in the stock market, and a little awareness of the event can help keep us from being victimized.
Parabolic moves tend to retrace 90-100% of the move. This is a tendency, mind you, not a guarantee. In addition, there is no exact definition of a parabolic move or a scientific understanding of what drives them. There are enough similarities, though, that we can identify and transpose to the next event.
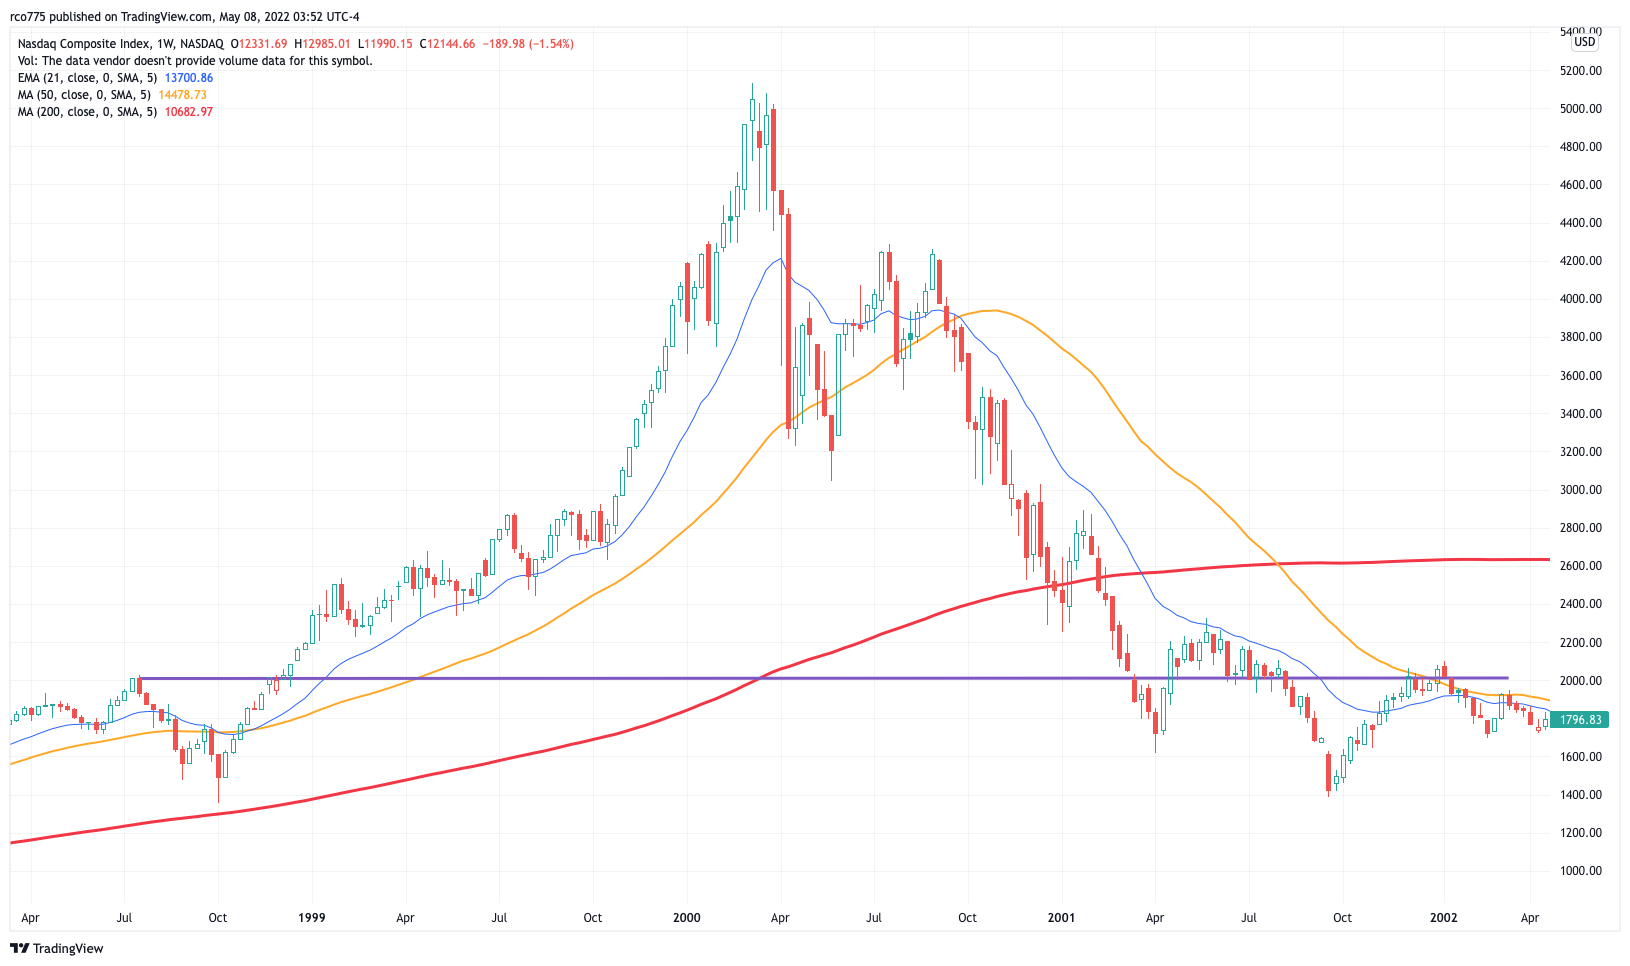
The first parabolic move I lived through was the mother of all events, the dot-com mania. The technology and internet stocks advanced in breathtaking fashion, with the Nasdaq Index going from 750 to 5100 in five years. There were some individual stocks, like Amazon and Yahoo, that were doubling and tripling every few months. I bought a stock, Microstrategy, at $11 on a Monday morning and sold it for $115 by Friday.
Grow Wealth, Not Risk. Trade alongside a 27 year hedge fund veteran
The real explosion, however, took place in 1999, the final year of the bubble. There was a challenging three-month correction that ended in October of 1998. The previous highs were taken out in December and then it was off to the races. The entire move was taken back by March 2001, and that was still far above the ultimate low that was hit by the end of 2002.
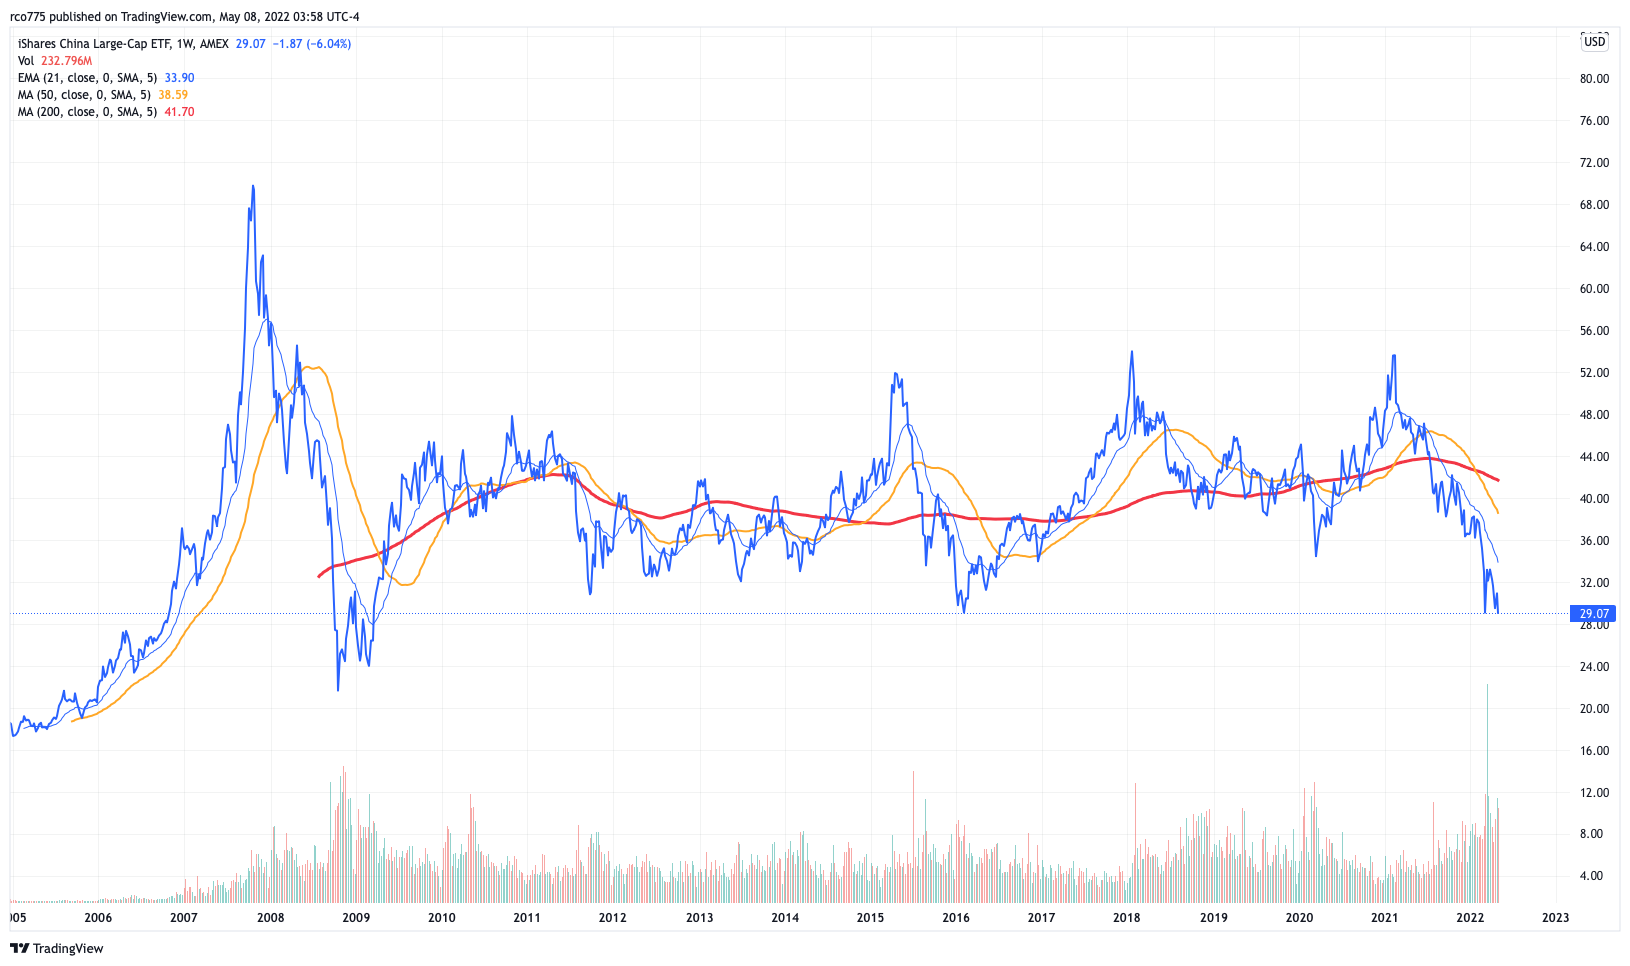
 China gave us another example of a fully retraced parabolic move. After spending over 20 years transforming into a modern economy, Chinese stocks grabbed investor attention in a way that hadn’t been seen since the internet craze. The main tracking index, FXI, went from $19 to $73 in two years. It fell all the way back, a 100% retracement, by October of 2008. Only one month ago, FXI was 36% above those 2008 lows.
Sometimes the damage from a parabolic move can last a generation.
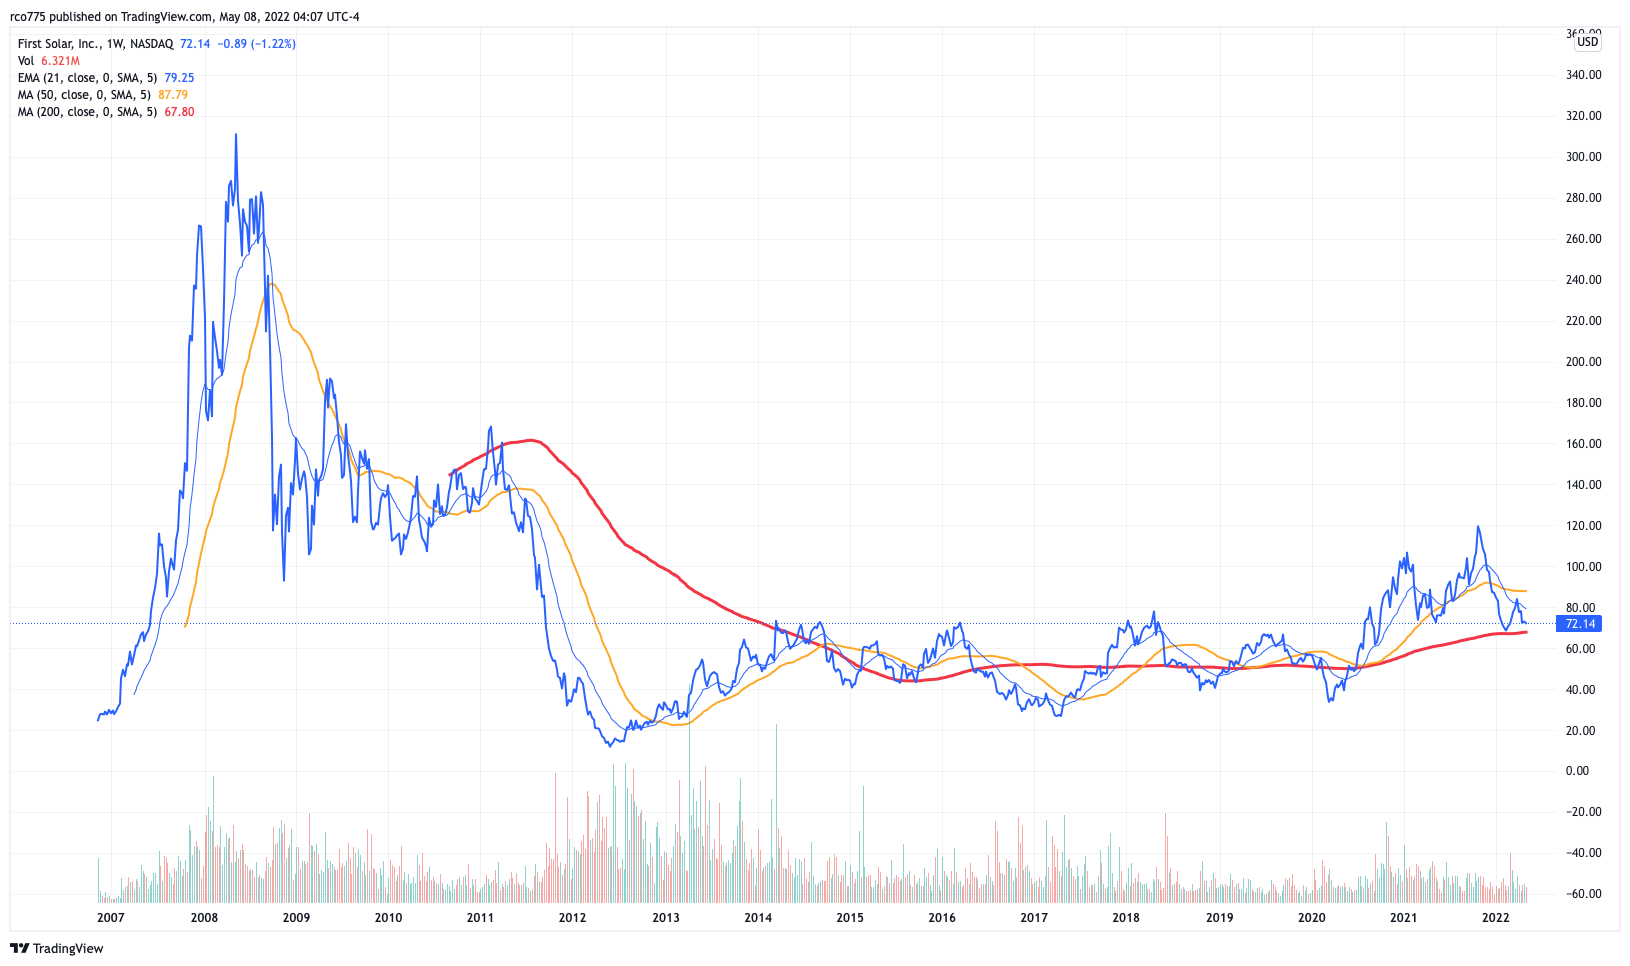
My youngest son is 14 years old. If he makes it the average lifespan for an American male, he will live long enough to see almost free energy. The sun warms the Earth and within 40 years it will provide us with energy costs approaching zero per kilowatt hour. Investors decided to catch some rays and starting in late 2006 the tanning boom was on. The poster stock for that run was First Solar, FSLR. It became public in November of 2006 at $25 a share. 18 months later the stock hit $317.
Like Icarus, investors quickly found out what happens when you fly too close to the sun. FLSR fell 73% within the next six months. That was more than a full retracement of what I consider the parabolic move, which began in October of 2007.
Fun fact for all you solar lovers out there; FSLR is currently trading at the same price it was 15 years ago.
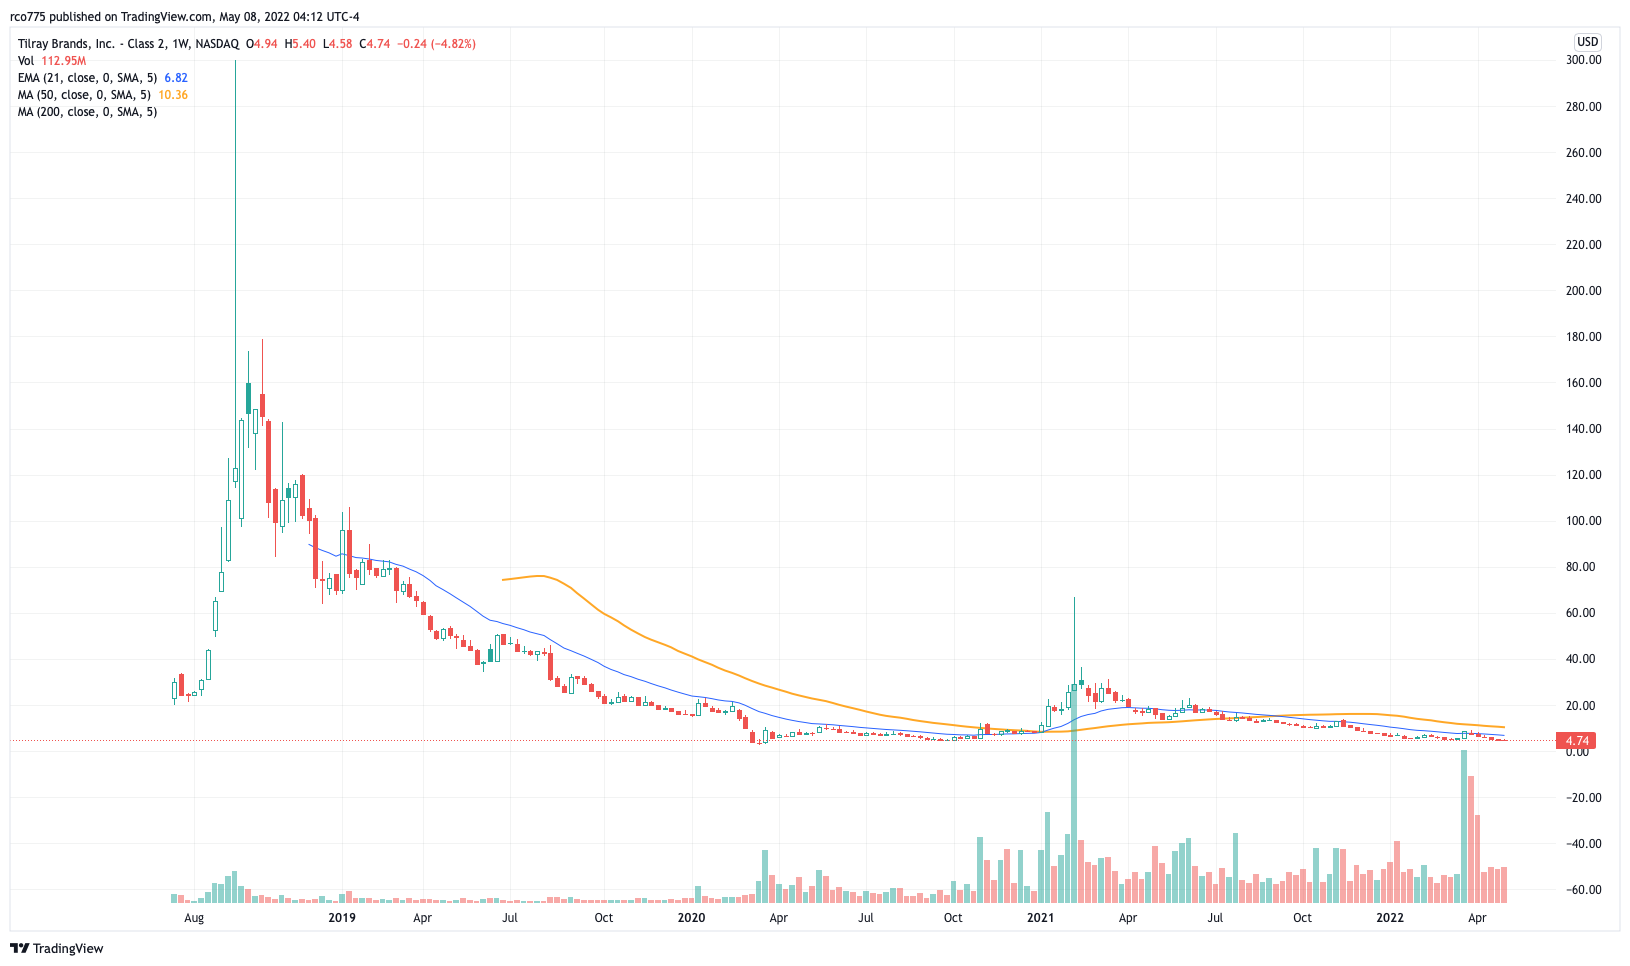
One of the craziest parabolic moves in recent history is the marijuana event north of the border. The Canadian government was planning on legalizing pot on a national level for both medical and recreational use in October of 2018. A Canadian company called Tilray Brands became one of the first publicly traded stocks on a US exchange, listing in July that year at $23 a share. The stock hit $300 only two months later. This was a GameStop type move. TLRY was down 88% nine months later.
Today, the buzz is completely gone with TLRY trading for $7.
BUBBELICIOUS
There are different causes of bubbles and the subsequent popping of those bubbles. Sometimes it is a new technology like the internet, other cases involve geo-political changes and occasionally it is a legal move. The one common denominator, though, is leverage. It is borrowed money. And it goes far beyond the margin your broker will lend you to buy more stocks.
If you deposit $10,000 into a Fidelity account, the broker will allow you to borrow another $10,000 from them to buy more stocks. This is called margin. Margin can be a magical way to increase your returns, but it also whacks you on the downside. Big money players can borrow more, much more, to get involved in the crazy of the day.
A tremendous amount of leverage helped create these bubbles and institutions trying to collect on the loans created the selling that led to the crashes.
Market historians like myself believe that one cause of the 1929 crash was the increase of the margin requirement. Today, you can buy twice as much as your cash deposit. Before the 1929 crash you could buy almost 10 times what you had in cash.
The massive selling that kicks in after the peaks washes away the speculation and destroys much of the borrowed money that allowed things to get so out of hand. We recently experienced a situation that got out of hand, and we might be looking at the early stages of a retracement of that situation.
Central banks around the world brought interest rates to the lowest levels in human history two years ago to help with Covid. Record amounts of leverage were suddenly unleashed into the financial markets and assets of every stripe took off. Gold, real estate, oil, cryptocurrencies and stocks went on spectacular runs.
This was driven by leverage.
Club Romulus: Where knowledge plus action equals profitBOND MARKET CLUES AND BLUES
One unpleasant side-effect of this leverage is the inflation we are living with today. It still amazes me that two years ago I paid $1.15 a gallon to fill my gas tank. Now a gallon of gas is $4.25.
The federal reserve is beginning to deal with this problem by raising interest rates. The bond market is pricing in these hikes by taking rates in government bonds much higher over the last three months. Interest rates have risen back to the same place they were three years ago in the Spring of 2019.
Recent bond market action inspired me to look at where the federal reserve had rates over the last several years. This is called the fed funds target rate. After increasing the fed funds target rate three weeks ago to .50% from the all-time low of .25%, most professionals agree the target rate will continue higher for the rest of this year.
What if the federal reserve takes rates all the way back to where they were three years ago? That was 2.50%, or 200 basis points above the current target. The bond market is telling us there is a high probability that the federal reserve is going to bring rates back to where they were three years ago.
What if the insanely huge stock market move after the Covid crash (one of the biggest equity jumps in history) also gets unwound? What if as rates are retracing, stocks and all the other assets that benefited from the record leverage retrace the same amount?
Unwinding and retracing.
If you are hoping for a return to 2021, you probably don’t want to know how far stocks must fall to retrace that move. It is ugly. The S&P 500 was trading under 3,000 in April of 2019. That is 35% lower than where it is today.
RETURN TO SENDER!
Let’s say the selling doesn’t get overdone to such a degree. What if stocks go back to where they were before the Covid crash? That results in a 25% fall from current prices. Even a one-third retracement from the Covid lows means another 15% hit from here.
I noticed something as I was going through these charts. The unwinding of the bubble, or the retracement, takes up to a year. That could easily be the case today. The yield curve inversion where short term rate rises above long term bond rates occurred at the tail end of March. This is a highly accurate predictor of recessions, but it can be up to 20 months early. April, which historically is the market's strongest month of the year, entirely failed to deliver.
WHAT TIME IS THE GUN SHOW?
On April 8, I wrote about relative strength and the importance of the small cap stocks to anyone hoping for a full return of the bull market. The small stocks picked up in late January, but that momentum has slowed and headed lower. This is another long-term warning sign.
Related: Romulus Report: The true bellwether April 8, 2022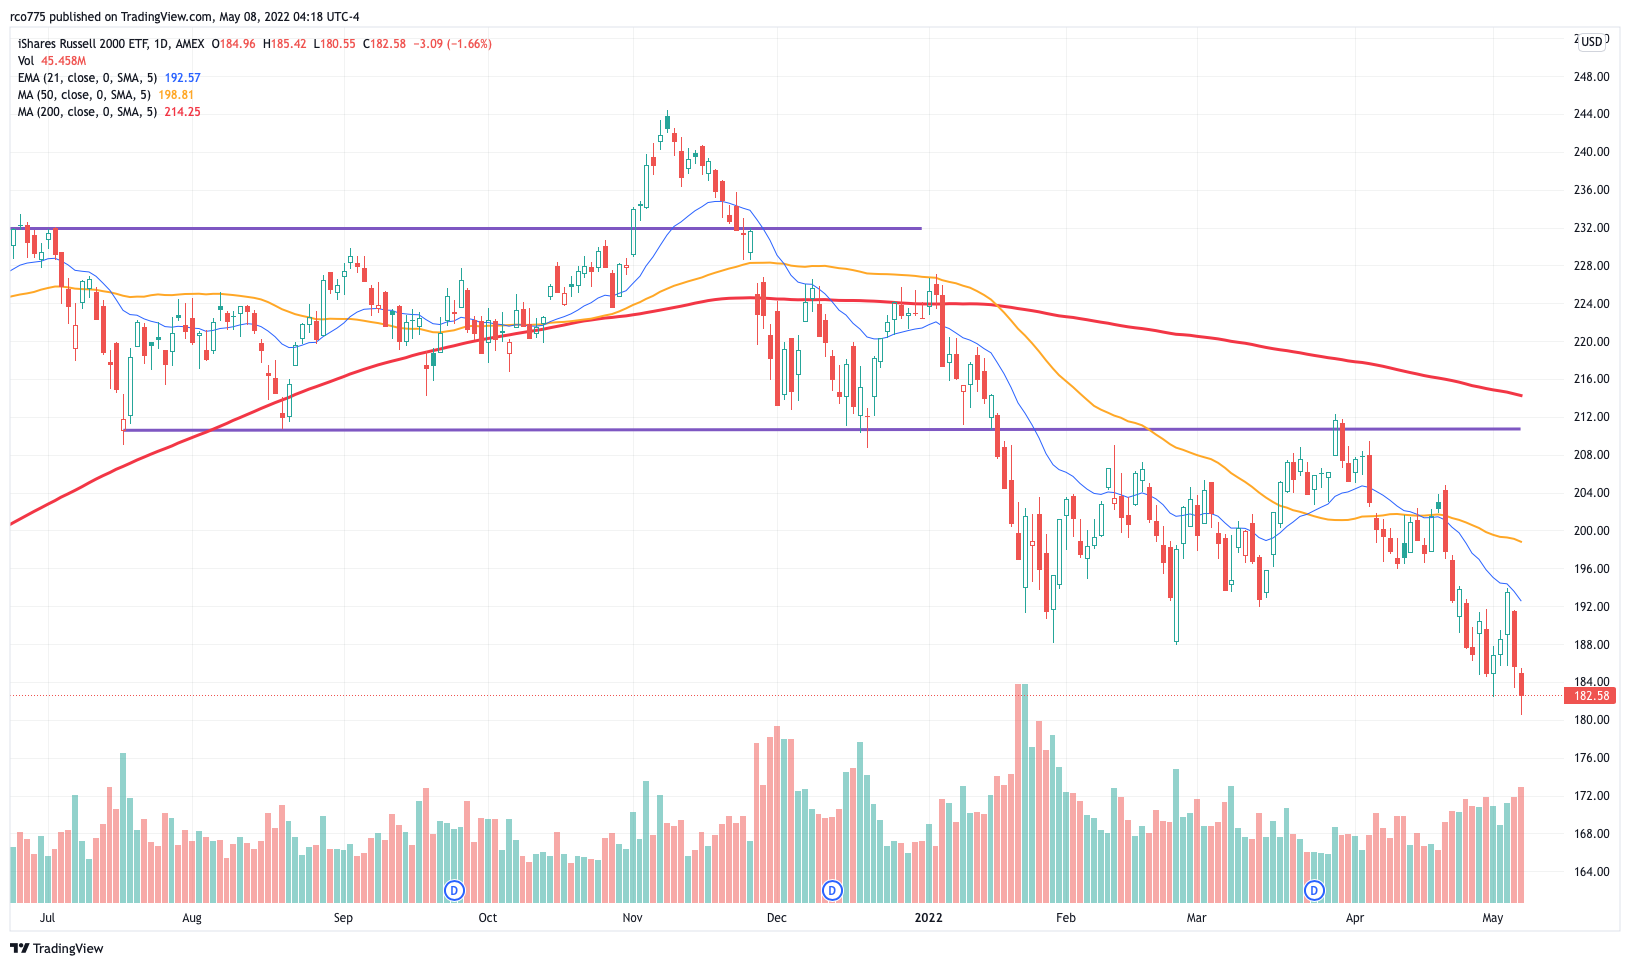
The stock market is full of tendencies. It tends to go up in April. It tends to go down in September. It tends to draw to big, round numbers. It is helpful to know these tendencies and remember that a tendency is not a guarantee. The interest rate drop into the Covid low was a parabolic move to the downside. It is retracing now. Stocks can do the same thing.
Remember:
Wealth, like Rome, cannot be built in a day. But, like Rome, it can be lost in a day. Watch for future announcements from Romulus about profitable market moves, important indicators, and major market swings. For trading education, mentoring, or to beat the markets with Romulus' trading group, contact romulusteaches@yahoo.com. About the author:
In his real-life existence, Romulus started on Wall Street in 1994 and traded for a hedge fund for 13 years. Since 1994, he has called every major market top ahead of time and profited from them, including the break of the Dot-com bubble in 2000, the market crashes of 2008 and 2009, and the Covid crash of 2020. Since 2020 he has been working with investors and traders to actively manage their portfolios by growing wealth, not risk, as a teacher and mentor working with Backpack Trader, a stock trading educational company.
Free Press International


